Money Control Place
  • Politics
  • Business
  • Stocks
  • Investing
  • Politics
  • Business
  • Stocks
  • Investing

Money Control Place

Stocks

Performance Profile Paints Different Pictures for Commodity and Equity ETFs

by admin March 28, 2025
March 28, 2025
Performance Profile Paints Different Pictures for Commodity and Equity ETFs

The performance profile for 2025 says a lot about the state of the market. Commodity-related ETFs are leading, non-cyclical equity ETFs are holding up the best and cyclical names are performing the worst. Clearly, this is not a positive picture for the stock market. This report will show how to interpret the performance profile and separate the leaders from the laggards using a ChartList.

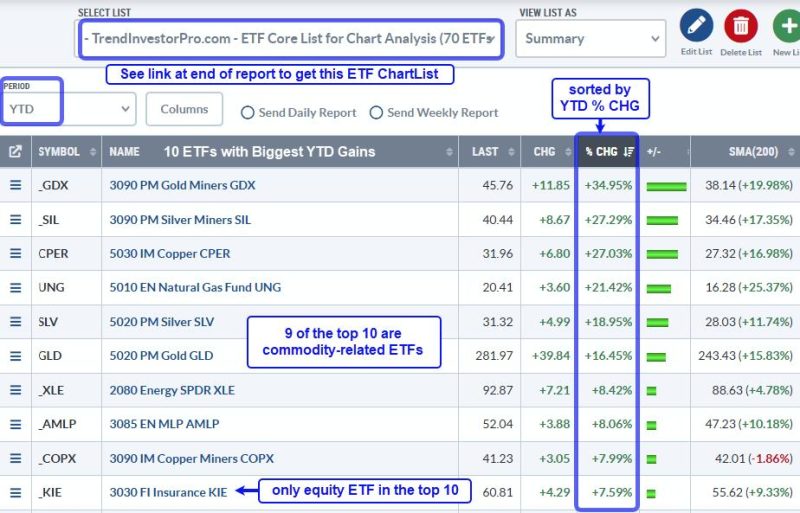
The following images come from the summary view of the TrendInvestorPro core ETF ChartList, which has 72 ETFs covering equities, commodities, bonds and crypto. The period setting is year-to-date (YTD) with the first example sorted by the year-to-date percentage change (% CHG) to see the leaders at the top. I added the SMA(200) column to see how far above/below each ETF is from its 200-day SMA. There are three performance takeaways.

First takeaway: commodity ETFs are leading. The image below shows the 10 ETFs with the highest year-to-date gains. Nine of the top ten are commodity-related ETFs. We are seeing strength in precious metals (gold, silver), industrial metals (copper, copper miners) and integrated energy (XLE). Broady speaking, this tells us that commodities are preferred over stocks. 

TrendInvestorPro covered the leading equity and commodity ETFs in our reports/videos this week. We saw breakouts in Aerospace-Defense and continued leadership in Insurance. Gold has blue skies as it trades near all-time highs, while Copper is looking dicey as it goes parabolic. Click here to take a trial and get immediate access.

Second takeaway: Equity ETFs from non-cyclical groups show relative strength. These include Aerospace-Defense (ITA), Insurance (KIE), Healthcare (XLV), Telecom (IYZ) and MLPs (AMLP). Non-cyclical groups are more insulated from economic fluctuations and often hold up better during periods of economic uncertainty.

Third takeaway: Equity ETFs from cyclical groups show the most pronounced downtrends. The example below is sorted by percent above 200-day SMA. The furthest below their 200-day SMAs are at the top and showing the most pronounced downtrends. Here we see ETFs related to Housing (ITB, XHB), Retail (XRT) and Semiconductors (SMH, SOXX). This is not the performance profile of a bull market. 

Need an organized and focused ETF ChartList that covers all bases? Our Core ETF ChartList has 72 names organized in a logical top-down manner. It includes 59 equity ETFs, 4 Treasury bond ETFs, 7 commodity ETFs and 2 crypto ETFs. Sign up for a trial at TrendInvestorPro and I will share this ChartList.

/////////////////////////////////////////////

0
FacebookTwitterGoogle +Pinterest
previous post
Joe Cavatoni: Gold Shining, Risk Assets Under Pressure — What’s Next?
next post
FCC is investigating Disney and ABC for DEI initiatives

Related Posts

Analyzing SIL, USO, and NVDA: Could These Bullish...

May 30, 2025

One Rule to Drastically Improve Your Trading

July 4, 2024

Three Things I WISH I’d Known About Trading

February 7, 2024

Can Nvidia’s Stock Skyrocket Again? Key Levels to...

June 28, 2024

Santa Claus Rally Alert: Predicting a 70% Surge...

December 7, 2023

From Oversold to Opportunity: Small Caps on the...

July 4, 2025

M2 Continues to Fall, Making Stocks Overvalued

August 23, 2023

Joe Rabil’s Undercut & Rally Pattern: From DROP...

June 21, 2025

The Bond Market is Signaling a Potential Short-Term...

March 20, 2024

Top Five Charts of 2023 #3: Market Breadth...

December 21, 2023

    Get free access to all of the retirement secrets and income strategies from our experts! or Join The Exclusive Subscription Today And Get the Premium Articles Acess for Free


    By opting in you agree to receive emails from us and our affiliates. Your information is secure and your privacy is protected.

    Latest

    • How I Triple My Returns With 3x Leveraged ETFs!

    • How to Find Compelling Charts in Every Sector

    • EVs Now Emit 73 percent Less Than Gasoline Cars Over Their Lifetime, Says ICCT Study

    • Cygnus Metals Limited: Issue of Performance Rights

    • FPX Nickel Announces Share-Based Compensation Grant

    • Blue Lagoon Resources Officially Opens Dome Mountain Gold Mine in British Columbia

    Categories

    • Business (1,287)
    • Investing (2,662)
    • Politics (3,699)
    • Stocks (1,711)
    • Uncategorized (20)
    • About us
    • Contact us
    • Privacy Policy
    • Terms & Conditions

    Disclaimer: MoneyControlPlace.com, its managers, its employees, and assigns (collectively “The Company”) do not make any guarantee or warranty about what is advertised above. Information provided by this website is for research purposes only and should not be considered as personalized financial advice. The Company is not affiliated with, nor does it receive compensation from, any specific security. The Company is not registered or licensed by any governing body in any jurisdiction to give investing advice or provide investment recommendation. Any investments recommended here should be taken into consideration only after consulting with your investment advisor and after reviewing the prospectus or financial statements of the company.

    Copyright © 2025 moneycontrolplace.com | All Rights Reserved