Money Control Place
  • Politics
  • Business
  • Stocks
  • Investing
  • Politics
  • Business
  • Stocks
  • Investing

Money Control Place

Stocks

Bank SPDR Extends on Breakout – How to Find the Setup before the Breakout

by admin February 8, 2025
February 8, 2025
Bank SPDR Extends on Breakout – How to Find the Setup before the Breakout

The Finance sector is leading the market with a new high this week and the Bank SPDR (KBE) is extending on its breakout. Today’s report will outline the lessons of the early January setup and show the mid January breakout. We then show how to set a re-evaluation level that would prove the breakout wrong.

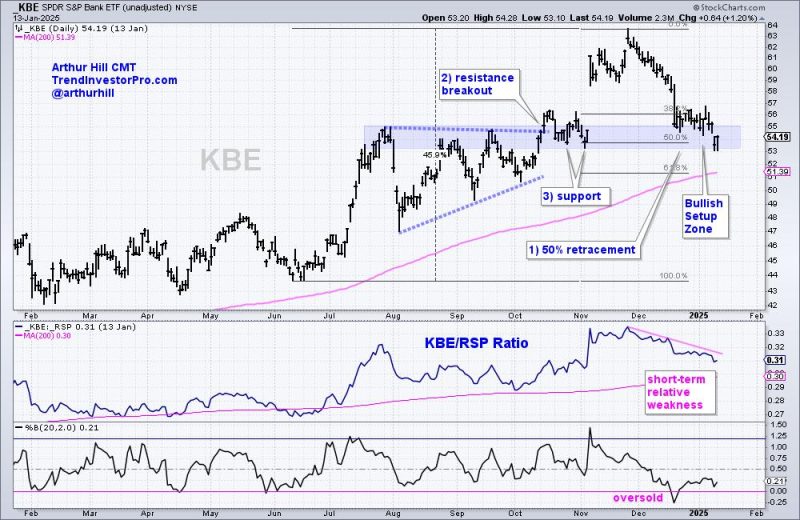
Let’s first review the setup from mid January. The chart below shows KBE hitting a new high in late November and then falling into mid January. The new high affirms a long-term uptrend and KBE remained well above the rising 200-day SMA. Thus, this decline was viewed as a correction within a long-term uptrend. During such pullbacks, I look for Bullish Setup Zones using retracement levels, prior resistance breaks and support levels. These are zones to watch for firming and a reversal.

Three items mark the Bullish Setup Zone on the chart above (see 1, 2 and 3). First, corrections within uptrends typically retraced 1/3 to 2/3 with 1/2 (50%) being the base case. A 50% retracement represents one step backward after two steps forward. Second, a key tenet of technical analysis is that broken resistance levels turn into support. KBE broke resistance around 55 and this area turns into future support. Third, KBE held the 53 area with two bounces in late October and early November (support). Taken together, the 50% retracement, broken resistance and support mark a Bullish Setup Zone in the 53-55 area (blue shading).

The strategy at TrendInvestorPro is to find and trade pullbacks within leading uptrends. Each week we bring you setups in ETFs and stocks. Click here to take a trial and learn more.

Once prices reach the Bullish Setup Zone, it is time to start drawing patterns and marking resistance levels. KBE formed a falling wedge and established short-term resistance with the January 6th high (pink line). Note that falling wedge patterns are typical for corrections within bigger uptrends. KBE broke out with a gap-surge in mid January and extended higher into February. The indicator window shows the price-relative (KBE/RSP ratio) turning up with a relative breakout. KBE is also leading again.

With an active breakout and extension higher, it is time to mark a re-evaluation level. This is the level that negates the wedge breakout and tells us something is wrong. Strong breakouts should hold so a failed breakout shows weakness. The breakout zone in the 55-56.5 area turns into first support (blue shading). A close below 55 would negate this breakout and call for a re-evaluation.

The strategy at TrendInvestorPro is to find and trade pullbacks within leading uptrends. Each week we define the market regime (bull or bear market), identify the leading groups using ETFs and highlight tradeable setups in stocks and ETFs. This week we featured the three biotech ETFs, two biotech stocks, a Mag7 stock and an industrial stock. Click here to take a trial and gain full access.

0
FacebookTwitterGoogle +Pinterest
previous post
Halcones Precious Metals Announces Surface Outcrop Chip Channel Sample Results, Including 20.05 g/t, 13.08 g/t, 8.54 g/t and 6.67 g/t Gold From Recent Field Work at Polaris Gold Project, Antofagasta Region Chile
next post
Hotel Stocks Spike: Why You Should Add These Stocks to Your Portfolio

Related Posts

SPY Resting at Support, But Financials Showing Strength

January 5, 2024

Three Ways I Use RSI To Analyze Trends

September 2, 2023

Think Really Hard About Who You Want On...

December 16, 2023

Sector Spotlight: US Stocks Once Again Lead the...

January 23, 2024

Bearish Signals & Risk Management: Protect Your Portfolio!

February 27, 2025

The Ord Oracle December 5, 2023

December 6, 2023

The Wisdom of Waiting for Your Pitch

August 3, 2023

Week Ahead: NIFTY Set To Open Lower; Relative...

April 6, 2025

Should You Be Worried About Poor Market Breadth?

July 3, 2024

Astronomical Daze

June 22, 2024

    Get free access to all of the retirement secrets and income strategies from our experts! or Join The Exclusive Subscription Today And Get the Premium Articles Acess for Free


    By opting in you agree to receive emails from us and our affiliates. Your information is secure and your privacy is protected.

    Latest

    • Run Your Stock Portfolio Like a Pro Sports Team

    • Leadership Rotation Could Confirm Corrective Phase

    • Breakouts, Momentum & Moving Averages: 10 Must-See Stock Charts Right Now

    • 1911 Gold Temporarily Suspends Operations at True North Complex due to Bissett Evacuation Order

    • Ontario Backs Down on Key Bill 5 Provisions, Echoes BC’s Mining Debate

    • Appeals Court Grants Trump Temporary Reprieve on Tariffs, “TACO” Taunts Gain Steam

    Categories

    • Business (1,223)
    • Investing (2,503)
    • Politics (3,699)
    • Stocks (1,614)
    • Uncategorized (20)
    • About us
    • Contact us
    • Privacy Policy
    • Terms & Conditions

    Disclaimer: MoneyControlPlace.com, its managers, its employees, and assigns (collectively “The Company”) do not make any guarantee or warranty about what is advertised above. Information provided by this website is for research purposes only and should not be considered as personalized financial advice. The Company is not affiliated with, nor does it receive compensation from, any specific security. The Company is not registered or licensed by any governing body in any jurisdiction to give investing advice or provide investment recommendation. Any investments recommended here should be taken into consideration only after consulting with your investment advisor and after reviewing the prospectus or financial statements of the company.

    Copyright © 2025 moneycontrolplace.com | All Rights Reserved