Money Control Place
  • Politics
  • Business
  • Stocks
  • Investing
  • Politics
  • Business
  • Stocks
  • Investing

Money Control Place

Stocks

Is this a Dead-Cat Bounce or a Bounce with Legs?

by May 4, 2024
May 4, 2024
Is this a Dead-Cat Bounce or a Bounce with Legs?

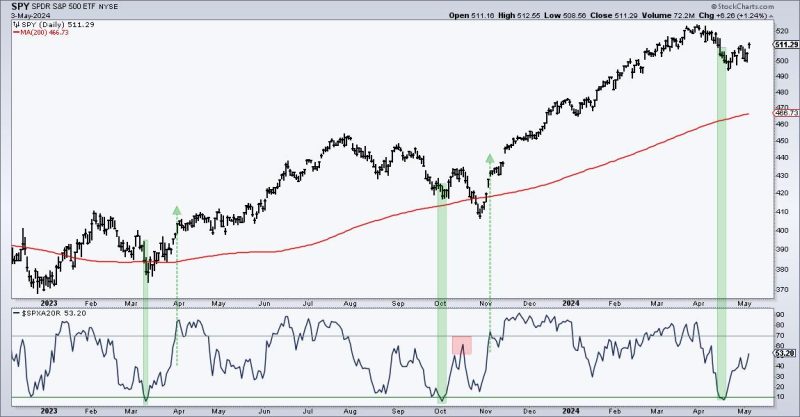
Stocks fell sharply into late April and then rebounded over the last two weeks. SPY fell 5.34% from March 28th to April 19th and then rebounded with a 3.26% gain the last two weeks. Does this bounce have legs? Chartists can separate serious bounces from dead-cat bounces using breadth. Today’s example will use the S&P 500 and the percentage of S&P 500 stocks their 20 day SMAs.  

There are two steps. First, the indicator needs to become oversold (setup). Second, we need to see a significant increase (breakout) in upside participation (signal). An oversold reading signals a significant decline and provides the setup for a bounce. Aggressive traders can trade the oversold condition. A subsequent move above the breakout level signals adequate participation to sustain the advance. Now comes the subjective part. We must choose our oversold and breakout levels. I am choosing 10 and 70 percent for SPX %Above 20-day SMA.

The green shading on the chart above shows when SPX %Above 20-day became oversold and the green arrow-lines mark the subsequent move above 70%. There were setup-signals in March-April and again in October-November. Both led to significant bounces. Notice the red shading where the indicator failed to clear 70% in mid October. This was a feeble bounce and SPY moved to a new low in late October. SPX %Above 20-day then surged above 70% in early November for a signal.  Recently, the indicator became oversold here in mid April for a setup and moved back above 50% this week. An oversold bounce is indeed underway, but I need to see a move above 70% to show a participation breakout.

We are monitoring the rebound in the S&P 500 and Nasdaq 100 at TrendInvestorPro (ChartTrader). Our 10 indicator composite indicator became oversold in mid April, but we have yet to see the required breadth thrust to signal a strong increase in participation. ChartTrader reports and videos provide broad market timing signals and trading setups for leading stocks and ETFs. This week we featured setups in the T-Bond ETF (TLT), the Biotech SPDR (XBI) and four Tech ETFs (IGV, SOXX, CIBR, SKYY). Click here for immediate access.

//////////////////////////////////////////////////

0
FacebookTwitterGoogle +Pinterest
previous post
VP Stakes: Trump meeting with potential running mates this weekend
next post
Key Breadth Indicator Flashes Buy Signal for Nasdaq 100

Related Posts

2 Consolidating Stocks Ready To Resume Their Uptrends

April 9, 2024

Not All Price Gaps Are the Same! Here’s...

May 20, 2025

The Best Five Sectors, #4

January 25, 2025

One MAJOR Concern About Friday’s Rally

June 3, 2024

S&P 500 Falls, Nears First Support Level —...

February 1, 2024

Technology Shares PLUNGE to Kick Off 2024

January 3, 2024

More from Mish’s Outlook 2024 — S&P 500

December 21, 2023

S&P Breaks Below 200-Day Moving Average: It’s Going...

October 20, 2023

BIG SURPRISE (Not)! The Fed Does Exactly What...

July 26, 2023

McClellan Oscillator for Investment Grade Bonds

November 10, 2023

    Get free access to all of the retirement secrets and income strategies from our experts! or Join The Exclusive Subscription Today And Get the Premium Articles Acess for Free


    By opting in you agree to receive emails from us and our affiliates. Your information is secure and your privacy is protected.

    Latest

    • Joe Rabil’s Undercut & Rally Pattern: From DROP to POP

    • RRG Alert Tech Vaults to ‘Leading’—Is XLK Signaling a New Rally?

    • Coelacanth Energy

    • Jeffrey Christian: Gold, Silver, PGMs — Short-term Prices and Key Drivers

    • Ericsson, Rogers Launch Canada’s First Underground 5G Network for Smart Mining

    • Crypto Market Recap: Bitcoin Price Stalls as Fed Holds Rates Steady, Circle Shares Jump

    Categories

    • Business (1,259)
    • Investing (2,583)
    • Politics (3,699)
    • Stocks (1,669)
    • Uncategorized (20)
    • About us
    • Contact us
    • Privacy Policy
    • Terms & Conditions

    Disclaimer: MoneyControlPlace.com, its managers, its employees, and assigns (collectively “The Company”) do not make any guarantee or warranty about what is advertised above. Information provided by this website is for research purposes only and should not be considered as personalized financial advice. The Company is not affiliated with, nor does it receive compensation from, any specific security. The Company is not registered or licensed by any governing body in any jurisdiction to give investing advice or provide investment recommendation. Any investments recommended here should be taken into consideration only after consulting with your investment advisor and after reviewing the prospectus or financial statements of the company.

    Copyright © 2025 moneycontrolplace.com | All Rights Reserved