HAPPY NEW YEAR!!! (I guess that is still allowed on day 5 ..)
Let’s kick off the start of the new year with a quick look at the condition of SPY before we dive into some sector rotation.
Is SPY Hitting Pause Button?
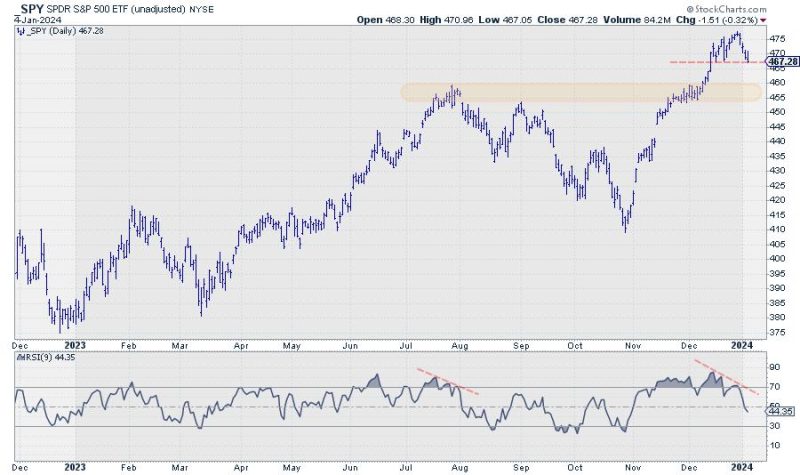
As you know I use weekly charts most of the time but the chart above is the daily chart of SPY as I want to highlight the fact that the market is currently resting at, or testing if you want, a short-term support level around 467-468.
Looking at the hourly chart, we can even argue it is breaking that support area. The final verdict will become clear at today’s (Friday 5th) close.
The negative divergence, penciled in on the RSI in the chart above, suggests that a pause or setback is imminent.
If and when this break indeed materializes, I am looking at support in the 455 area as a first possible target. When support holds and we bounce up we might be seeing a small H&S formation in the making. Either way, the fact that all this is happening just shy of heavy overhead resistance around 480, causes upside potential to be limited in the near term.
This is very well visible on the weekly chart above where horizontal resistance coming off the early 2022 and the rising resistance line that marks the upper boundary of the channel are coming together, causing double resistance.
All in all, at least a small setback or pause to digest the recent rally seems imminent.
Sector Rotation
The longer-term sector rotation, as seen on the RRG above, still favors a positive outlook for SPY. The three defensive sectors; Staples, Utilities, and Health Care are at the left-hand side of the graph and traveling at a negative RRG-Heading. This is a rotation that is characteristic of a strong market in general as investors prefer more offensive sectors.
A rotation that stands out is the opposite move for Real Estate (XLRE) and Energy (XLE). But the one sector I want to highlight here is Financials (XLF).
On the weekly RRG, the XLF tail is inside the leading quadrant and heading further into it at a strong RRG-Heading.
On the daily chart, the XLF tail is inside the weakening quadrant has already curled back up, and is now heading back to the leading quadrant. This brings the daily rotation back in sync with the weekly which usually is a strong sign for further improvement against SPY.
Financials
To find individual stocks inside the Financials sector you can pull up the pre-defined RRG with all the members in XLF.
A quick way to identify an industry within the financials sector that holds potentially interesting stocks is to sort the table below the RRG on the “Industry” column (just click at the top of the column) and look at the quadrant colors. The table above shows that all banks are inside the leading quadrant. Clicking on the line of the individual stock will highlight the tail on the RRG. By using the arrow (up/dn) you can browse through the individual tails to get a better handle and find names to bring up on a price chart.
#Stay alert, –Julius

