Money Control Place
  • Politics
  • Business
  • Stocks
  • Investing
  • Politics
  • Business
  • Stocks
  • Investing

Money Control Place

Stocks

This Combination Makes Trading Next Week VERY Dicey

by December 9, 2023
December 9, 2023
This Combination Makes Trading Next Week VERY Dicey

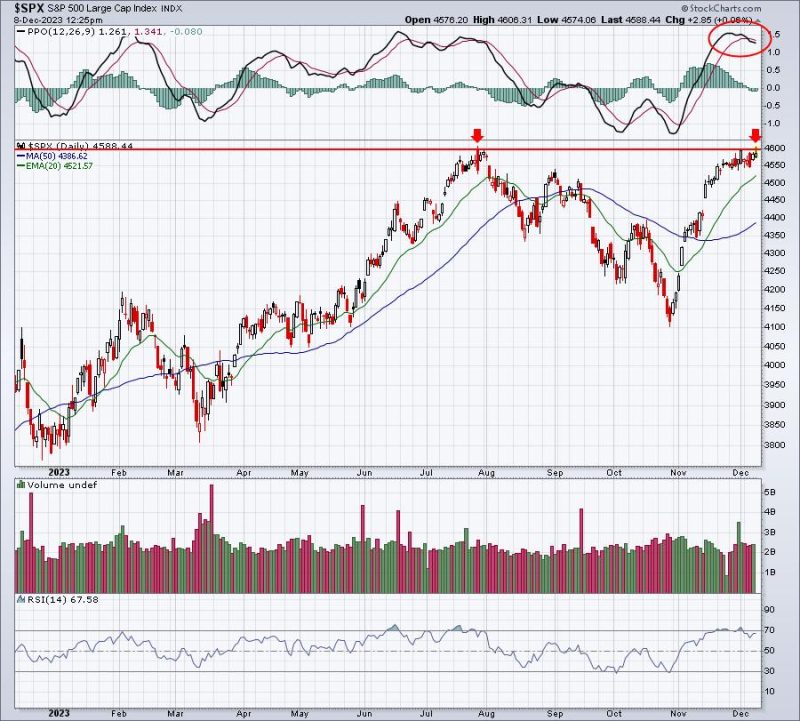
I think just about everyone is on “4600 watch” on the S&P 500 and I can’t blame them. It’s a big level. That was our high in July and now the subsequent recovery has returned the S&P 500 to the most critical price resistance of 2023:

At the time of this writing, the S&P 500 is a dozen points away from this key level, with an earlier high above 4600. A false breakout on the close today, accompanied by that daily PPO rolling over isn’t a great look and combination, knowing how important this breakout would. But even a breakout doesn’t exactly suggest it’s an all-clear-ahead signal. That PPO is suggesting momentum is seriously slowing right now. If we do see a breakout, then be on the lookout for a reversing candle at some point next week. That very well could precede a bout of selling, perhaps as much as 3-5%.

In addition to a few technical reasons to be cautious, next week isn’t a great one for the S&P 500 historically either. Should we struggle the next 1-2 weeks, there is a silver lining. The December 22 through December 31 period is extremely bullish as you can see from the daily annualized returns on the S&P 500 (since 1950) below:

December 21: +71.54%December 22: +31.82%December 23: +16.67%December 24: +27.39%December 25: Market Closed – Christmas holidayDecember 26: +126.94%December 27: +40.72%December 28: -10.07%December 29: +45.11%December 30: +29.78%December 31: +38.5%

For the entire Dec 21-31 period, the annualized return of +40.21% is more than 4x the average S&P 500 return of roughly 9% since 1950. S&P 500 prices rarely see a cumulative loss during these final 11 days of the year.

I believe it’s critical to fully understand the key historical trends on the S&P 500. At EarningsBeats.com, we continue to offer a FREE 7-page PDF report on critical S&P 500 historical trends that every investor/trader should be aware of. To download your FREE copy, CLICK HERE!

Happy trading!

Tom

0
FacebookTwitterGoogle +Pinterest
previous post
Here’s Why Growth Stocks Outperformed Last Week!
next post
The U.S. added 199,000 jobs in November and the unemployment rate fell to 3.7%

Related Posts

GNG TV: “All About That Base(ing)” New Go...

July 13, 2023

Is Sentiment Too Bullish?

December 22, 2023

Bearish Divergences Cause Market to Drop

July 7, 2023

Core PCE Data Has Powell Pleased – May...

March 30, 2024

S&P 500 Breaking Out Again: What This Means...

November 11, 2025

The Top Five Charts of 2023

December 23, 2023

GNG TV: Active vs. Passive Investing

January 19, 2024

How William O’Neil – The Legendary Investor –...

August 26, 2023

Energy Sector (XLE) Hits All-Time High, Should We...

September 8, 2023

Week Ahead: NIFTY Likely To Ring In The...

December 30, 2023

    Get free access to all of the retirement secrets and income strategies from our experts! or Join The Exclusive Subscription Today And Get the Premium Articles Acess for Free


    By opting in you agree to receive emails from us and our affiliates. Your information is secure and your privacy is protected.

    Latest

    • S&P 500 Breaking Out Again: What This Means for Your Portfolio

    • Early Warning News Release Regarding the Issuance of Securities of Stallion Uranium Corp.

    • Homerun Resources Inc. Receives Conditional Approval from the TSXV for $6 Million Financing with Institutional Investor

    • China’s Rare Earths Crackdown Puts MP Materials in the Spotlight

    • Bert Dohmen: Gold Price Going “Much Higher,” Silver to Play Catch Up

    • S&P 500 Breaking Out Again: What This Means for Your Portfolio

    Categories

    • Business (1,416)
    • Investing (3,199)
    • Politics (3,699)
    • Stocks (1,862)
    • Uncategorized (20)
    • About us
    • Contact us
    • Privacy Policy
    • Terms & Conditions

    Disclaimer: MoneyControlPlace.com, its managers, its employees, and assigns (collectively “The Company”) do not make any guarantee or warranty about what is advertised above. Information provided by this website is for research purposes only and should not be considered as personalized financial advice. The Company is not affiliated with, nor does it receive compensation from, any specific security. The Company is not registered or licensed by any governing body in any jurisdiction to give investing advice or provide investment recommendation. Any investments recommended here should be taken into consideration only after consulting with your investment advisor and after reviewing the prospectus or financial statements of the company.

    Copyright © 2025 moneycontrolplace.com | All Rights Reserved