Money Control Place
  • Politics
  • Business
  • Stocks
  • Investing
  • Politics
  • Business
  • Stocks
  • Investing

Money Control Place

Stocks

Should We Use Weakness To Accumulate NVDA Before Its Next Launch?

by October 22, 2023
October 22, 2023
Should We Use Weakness To Accumulate NVDA Before Its Next Launch?

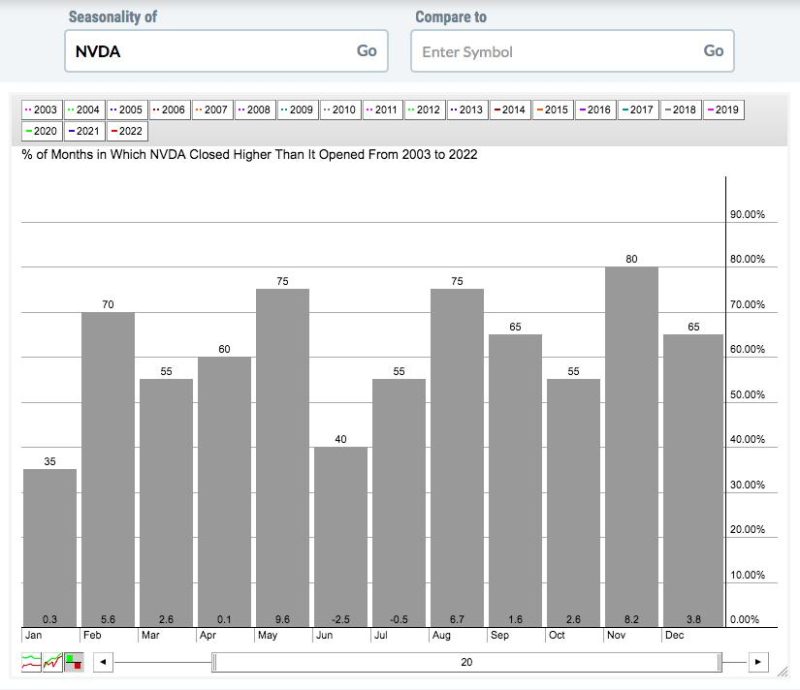
Over the past six trading days, NVDA has fallen from a high of 476.09 to Friday’s low of 410.78. That’s a drop of 65.31, or nearly 14%, in just over one week. Would it make sense to take advantage of this selling? Well, like any other stock, NVDA is subject to overall market headwinds or tailwinds. Currently, there are plenty of headwinds and there are also reasons to believe these headwinds will persist in the very near-term. I discussed the current environment in an article I published earlier today, “Odds Favor Further Selling This Week (Maybe a LOT of it)”. Be sure to check it out. Part of trading and/or investing success boils down to preparation. For those interested in NVDA, check out its 20-year seasonality chart from 2003 to 2022:

Do you notice that the probability of monthly gains spikes in the second month of each calendar quarter – February, May, August, and November? Those are the four most likely calendar months that we’ll see gains in NVDA. And how about those average monthly returns? To summarize, here’s how the average returns break down by calendar quarter months:

1st month of calendar quarter (Jan, Apr, Jul, Oct): +2.5%2nd month of calendar quarter (Feb, May, Aug, Nov): +30.1%3rd month of calendar quarter (Mar, Jun, Sep, Dec): +5.5%

NVDA has been a tremendous performer, actually one of the best-performing stocks of this century. But did you know that the second calendar month of each calendar quarter is responsible for most of those gains? There’s one reason for this bullish timing on NVDA – earnings! NVDA typically reports earnings in February, May, August, and November. And earnings drive prices. There’s a TON of NVDA accumulation (by big Wall Street firms) heading into earnings each quarter. That’s why we see those crazy returns when we compare the 1st, 2nd, and 3rd months of calendar quarters. Knowing this type of information can be a real game changer for traders, wouldn’t you agree? Don’t you feel like your odds of winning trades on NVDA just improved?

I’m a stock market history buff. If you want to learn more about the stock market and how it operates, you MUST understand history and historical tendencies. It’s what I discuss in my FREE pdf report, “Money Flows”. Use THIS LINK to download your copy NOW – and for FREE!

Happy trading!

Tom

0
FacebookTwitterGoogle +Pinterest
previous post
Odds Favor Further Selling This Week (Maybe a LOT of it)
next post
Canada Silver Cobalt Works Secures OJEP Funding for Sangster and St. Denis Lithogeochemical Exploration

Related Posts

GNG TV: Does a BIG Changing of the...

August 3, 2023

Stock Market Indexes Shatter Critical Support Levels. Watch...

October 28, 2023

Stock Market Delivered Huge Gift, Wipes Away Recession...

December 22, 2023

Looking Outside the Stock Market for Opportunities

October 26, 2023

MEM TV: Tech Stock Decline Spooks Market

July 22, 2023

Momentum Leaders Are Rotating — Here’s How to...

July 25, 2025

US Strikes Iran: What Comes Next For Stocks?

June 23, 2025

Time for Sweet Talk: Sugar Futures

January 23, 2024

200-Day Moving Average Confirms Bearish Phase

April 17, 2025

Investing in 2024: 3 Promising Opportunities To Watch

December 29, 2023

    Get free access to all of the retirement secrets and income strategies from our experts! or Join The Exclusive Subscription Today And Get the Premium Articles Acess for Free


    By opting in you agree to receive emails from us and our affiliates. Your information is secure and your privacy is protected.

    Latest

    • S&P 500 Breaking Out Again: What This Means for Your Portfolio

    • ReeXploration Identifies Large-Scale Uranium Target at Eureka Project, Namibia

    • FORTUNE BAY ACCELERATES DEVELOPMENT AT GOLDFIELDS FOLLOWING STRONG PEA AND FINANCING

    • Osisko Intersects 330.6 Metres Averaging 0.46% Cu in Southern Extension at Gaspé

    • S&P 500 Breaking Out Again: What This Means for Your Portfolio

    • Mark Skousen: Gold, Silver in Major Bull Market, “Permanent Inflation” is Here

    Categories

    • Business (1,409)
    • Investing (3,142)
    • Politics (3,699)
    • Stocks (1,848)
    • Uncategorized (20)
    • About us
    • Contact us
    • Privacy Policy
    • Terms & Conditions

    Disclaimer: MoneyControlPlace.com, its managers, its employees, and assigns (collectively “The Company”) do not make any guarantee or warranty about what is advertised above. Information provided by this website is for research purposes only and should not be considered as personalized financial advice. The Company is not affiliated with, nor does it receive compensation from, any specific security. The Company is not registered or licensed by any governing body in any jurisdiction to give investing advice or provide investment recommendation. Any investments recommended here should be taken into consideration only after consulting with your investment advisor and after reviewing the prospectus or financial statements of the company.

    Copyright © 2025 moneycontrolplace.com | All Rights Reserved