Money Control Place
  • Politics
  • Business
  • Stocks
  • Investing
  • Politics
  • Business
  • Stocks
  • Investing

Money Control Place

Stocks

Equal-weight Semis Break Down – Is SOXX Next? – with video (Free)

by October 16, 2023
October 16, 2023
Equal-weight Semis Break Down – Is SOXX Next? – with video (Free)

Today’s report will compare charts and performance for the Semiconductor ETF (SOXX) and the Semiconductor SPDR (XSD). SOXX represents large-caps and is holding up. XSD represents the average semiconductor stock and it is not holding up. Broad weakness within the semiconductor group is likely to spread to large-cap semiconductor stocks and SOXX. Note that we will cover this and more in tomorrow’s Chart Trader Report & Video.

Equal-weight Semis Break Down – Is SOXX Next?

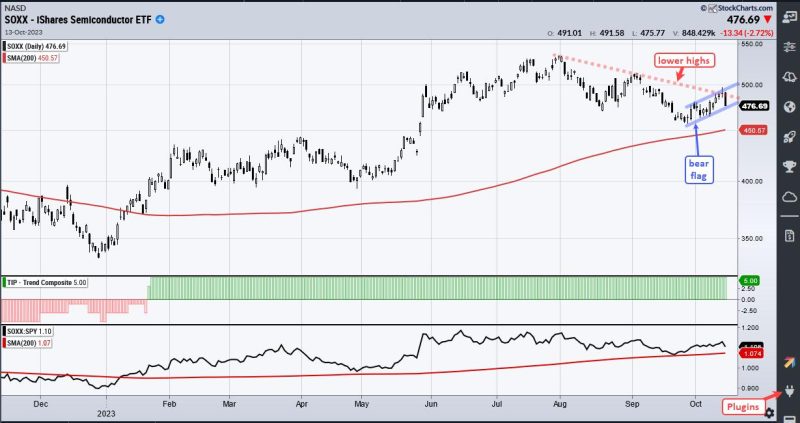
The first chart shows SOXX peaking in late July and trending lower the last few months (red dashed line). SOXX remains above its 200-day SMA and the Trend Composite remains positive, but a bear flag formed here in October (blue lines). Flags are short-term continuation patterns. The prior move (September) was down so this flag is bearish. A flag break would signal a continuation lower and target a move to the next support zone in the 400 area.

The second chart shows a completely different picture. The Semiconductor SPDR (XSD), which represents the average semiconductor stock, is in a downtrend and underperforming. XSD is below its 200-day SMA and its Trend Composite is negative. The lower window shows the price-relative (XSD:SPY Ratio) below its 200-day SMA since mid August. This means XSD is underperforming SPY. Short-term, XSD broke flag support on Friday and this targets a move to the next support zone in the 175 area.

Large-caps semis (SOXX) are holding up for now, but relative and absolute weakness in the average semi (XSD) is a concern. I expect this broad weakness to extend to large-cap semis (SOXX). By extension, this would be negative for the tech sector, QQQ and the broader market (SPY).

Tomorrow at Chart Trader we will cover broadening weakness within the stock market, a handful of leading groups and some bearish chart setups (stocks). Chart Trader reports and videos are published every Tuesday and Thursday. Click here for immediate access.   

//////////////////////////////////////////////////

0
FacebookTwitterGoogle +Pinterest
previous post
Haley blasts House Republicans over speaker battle: ‘Get it together’
next post
Sensitive Sectors Continue to Prop Up the S&P 500

Related Posts

HUGE NEWS! Our Most Important Site-Wide Product Release...

February 3, 2024

This Beaten-Down Magnificent Seven Stock is Poised to...

February 17, 2024

30 Dow Stocks in 20 Minutes: Joe Rabil’s...

July 17, 2025

This Is What I Mean By Leading Stocks...

May 10, 2024

MEM TV: New Uptrends Amid Sector Rotation!

June 12, 2023

Emerging Stocks to Watch – Breakouts, Momentum &...

May 20, 2025

Commodity and Healthcare Related ETFs Lead in 2025...

March 8, 2025

S&P 500 Breaking Out Again: What This Means...

August 7, 2025

Watch the Unemployment Rate – It Could Change...

October 27, 2023

The Hidden Meaning Behind the Tech Sector’s Rally...

May 2, 2025

    Get free access to all of the retirement secrets and income strategies from our experts! or Join The Exclusive Subscription Today And Get the Premium Articles Acess for Free


    By opting in you agree to receive emails from us and our affiliates. Your information is secure and your privacy is protected.

    Latest

    • S&P 500 Breaking Out Again: What This Means for Your Portfolio

    • ReeXploration Identifies Large-Scale Uranium Target at Eureka Project, Namibia

    • FORTUNE BAY ACCELERATES DEVELOPMENT AT GOLDFIELDS FOLLOWING STRONG PEA AND FINANCING

    • Osisko Intersects 330.6 Metres Averaging 0.46% Cu in Southern Extension at Gaspé

    • S&P 500 Breaking Out Again: What This Means for Your Portfolio

    • Mark Skousen: Gold, Silver in Major Bull Market, “Permanent Inflation” is Here

    Categories

    • Business (1,409)
    • Investing (3,142)
    • Politics (3,699)
    • Stocks (1,848)
    • Uncategorized (20)
    • About us
    • Contact us
    • Privacy Policy
    • Terms & Conditions

    Disclaimer: MoneyControlPlace.com, its managers, its employees, and assigns (collectively “The Company”) do not make any guarantee or warranty about what is advertised above. Information provided by this website is for research purposes only and should not be considered as personalized financial advice. The Company is not affiliated with, nor does it receive compensation from, any specific security. The Company is not registered or licensed by any governing body in any jurisdiction to give investing advice or provide investment recommendation. Any investments recommended here should be taken into consideration only after consulting with your investment advisor and after reviewing the prospectus or financial statements of the company.

    Copyright © 2025 moneycontrolplace.com | All Rights Reserved