Money Control Place
  • Politics
  • Business
  • Stocks
  • Investing
  • Politics
  • Business
  • Stocks
  • Investing

Money Control Place

Stocks

Which Cyber Security ETF is the Strongest?

by September 28, 2023
September 28, 2023
Which Cyber Security ETF is the Strongest?

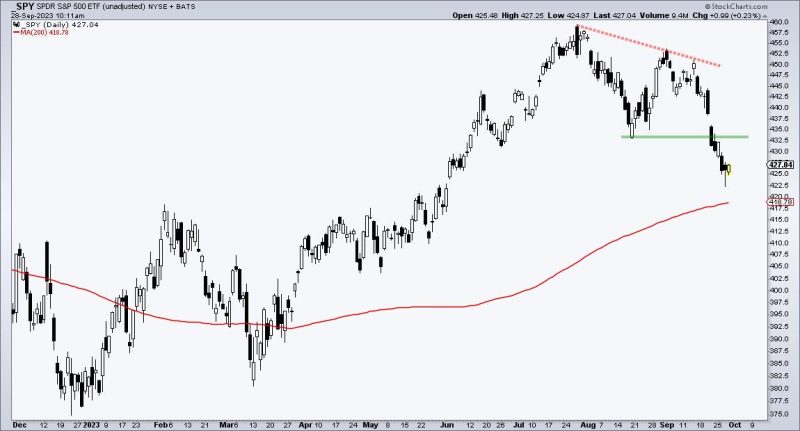
Which Cyber Security ETF is the StrongestStocks were hit hard the last two weeks with the S&P 500 SPDR (SPY) breaking below its August low. SPY also forged a lower high from July to August. Stocks and ETFs that held above their August lows are showing relative strength. With that in mind, the three cyber security ETFs stand out and one is stronger than the others. This standout and two cybersecurity stocks were featured in Thursday’s Chart Trader Report & Video.

The first chart shows SPY to set the reference points. First, SPY formed a lower high from July to early September (red dashed lines). Second, SPY broke the August low with a sharp decline (green line). These are the two reference points to keep in mind going forward.

The next chart shows the Cybersecurity ETF (CIBR). First, notice that it formed two equal highs in the 47.50 area (red dashed line). CIBR did not forge a lower high and showed more strength. Second, CIBR held above the August low during the September decline. Again, CIBR is holding up better and showing relative strength.

The next chart shows the Cybersecurity ETF (BUG) with the same characteristics.

The next chart shows the Cyber Security ETF (HACK) with different characteristics. HACK forged a higher high and a 52-week high on September 1st. This higher high means it was stronger than SPY on the way up. HACK fell with the rest of the market over the last two weeks, but remains well above the August low. HACK shows relative strength on this decline.

The chart above also shows a bullish continuation pattern in play. This pattern is explained in the video above. Note that I featured HACK and two cybersecurity stocks in the Chart Trader Report & Video on Thursday morning. This report also showed three short-term breadth indicators becoming oversold the last two days. Click here to learn more and gain immediate access.

The TIP Indicator Edge Plug-in for StockCharts ACP has 11 indicators to enhance your analysis and trading. These include the Trend Composite, Momentum Composite and ATR Trailing Stop. Click here to learn more and take your trading to the next level.

—————————————

0
FacebookTwitterGoogle +Pinterest
previous post
Senate unanimously passes resolution to reinstate formal dress code after Sen. John Fetterman controversy
next post
What to Do When The MACD Is Broken

Related Posts

Santa Claus Rally Alert: Predicting a 70% Surge...

December 7, 2023

S&P 500 Breaking Out Again: What This Means...

August 4, 2025

GNG TV: S&P 500 Breakout — Will the...

December 15, 2023

S&P 500 Breaking Out Again: What This Means...

September 17, 2025

Another New High for the Year?

July 19, 2023

Is Cannabis Finally Low Enough to Go High?

June 22, 2023

Retail is at a Crossroads—Buy Now or Stay...

February 28, 2025

Granny Retail a Big Barometer: Video Analysis

June 23, 2023

The Best Technical Indicator for Long-Term Investors

February 24, 2024

The Top Performing Sector is Utilities?!?

May 9, 2024

    Get free access to all of the retirement secrets and income strategies from our experts! or Join The Exclusive Subscription Today And Get the Premium Articles Acess for Free


    By opting in you agree to receive emails from us and our affiliates. Your information is secure and your privacy is protected.

    Latest

    • S&P 500 Breaking Out Again: What This Means for Your Portfolio

    • CHARBONE Hydrogen Secures Harnois Energies’ Hydrogen Assets to Accelerate Clean Ultra High Purity Hydrogen Production at Sorel-Tracy

    • CHARBONE Hydrogene securise les actifs de production d’hydrogene d’Harnois Energies pour accelerer la production d’hydrogene propre a ultra haute purete a Sorel-Tracy

    • Anteros Metals Enters Into Letter of Intent and Announces Private Placement of up to $1 Million

    • Cartier Cuts 35.5 g/t Au over 0.5 m and 20.4 g/t Au over 0.5 m at Main ; Confirms Near-Surface High-Grade Gold Potential; Advances Toward VG10 Zone

    • Sranan Gold Samples Up To 26.7 Grams Per Tonne Gold in The Poeketi Pit Area of The Tapanahony Project in Suriname

    Categories

    • Business (1,395)
    • Investing (2,995)
    • Politics (3,699)
    • Stocks (1,812)
    • Uncategorized (20)
    • About us
    • Contact us
    • Privacy Policy
    • Terms & Conditions

    Disclaimer: MoneyControlPlace.com, its managers, its employees, and assigns (collectively “The Company”) do not make any guarantee or warranty about what is advertised above. Information provided by this website is for research purposes only and should not be considered as personalized financial advice. The Company is not affiliated with, nor does it receive compensation from, any specific security. The Company is not registered or licensed by any governing body in any jurisdiction to give investing advice or provide investment recommendation. Any investments recommended here should be taken into consideration only after consulting with your investment advisor and after reviewing the prospectus or financial statements of the company.

    Copyright © 2025 moneycontrolplace.com | All Rights Reserved