Money Control Place
  • Politics
  • Business
  • Stocks
  • Investing
  • Politics
  • Business
  • Stocks
  • Investing

Money Control Place

Stocks

IWM Closes below Long-term Moving Average. Does it Matter?

by September 14, 2023
September 14, 2023
IWM Closes below Long-term Moving Average. Does it Matter?

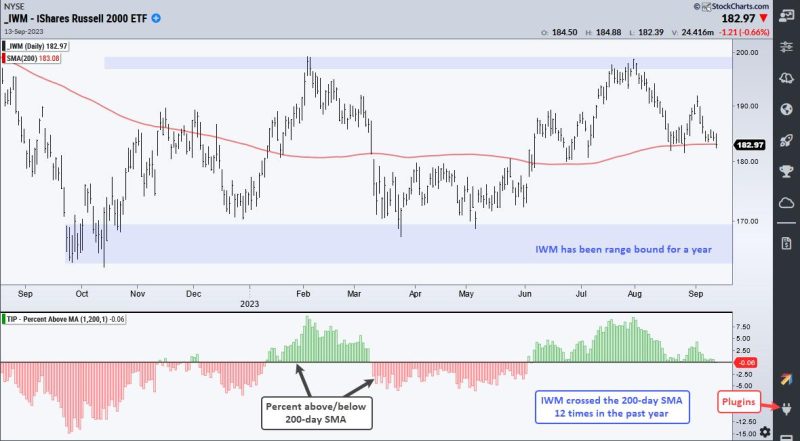
The Russell 2000 ETF (IWM) closed below the 200-day SMA for the first time since, well, June 1st. The last cross was not that long ago and recent crosses simply resulted in whipsaws. Truth be told, 200-day SMA crosses are not that relevant for IWM.

Testing 200-day SMA Crosses for IWM (and SPY)

The chart below shows IWM in the top window and the Percent above MA (1,200,1) indicator in the lower window. This indicator turns green when IWM closes above its 200-day and red when IWM closes below. There were fourteen crosses in the past year alone. Note that this indicator is part of the TIP Indicator Edge Plugin for StockCharts ACP.

IWM 200-day SMA

A dozen crosses and nothing to show makes sense because IWM is stuck in a trading range. Moving averages are trend-following indicators that perform poorly when price moves sideways. The chart above shows IWM trading between 162 and 200 since last September (blue shading). Moving average signals are resulting in whipsaws.

One year is not long enough to decide the efficacy of a moving average cross. As such, I tested the 200-day cross in IWM over the last 20 years. The first test is a long and short test. This means buying/covering on a cross above the 200-day SMA and selling/shorting on a cross below the 200-day SMA. As the top line shows, such a strategy did not work because the Compound Annual Return was -3.02%.

The second line shows a long only strategy and the 200-day cross managed to make some money. Not much though. The Compound Annual Return was a meager 2.09%. This meager return came with a high cost because the Maximum Drawdown was a whopping 38.2%. For comparison, SPY generated at 5.68% Compound Annual Return with a 21.98% Maximum Drawdown. There is some value in SPY signals. As such, I would ignore the 200-day SMA crosses in IWM and pay attention to signals in SPY.

Check out the Chart Trader report at TrendInvestorPro to learn more on current market conditions. Thursday’s report covered:

risk-on/risk-off dynamics in the marketlack of participation in two breadth indicatorsa key test for the 20+ Yr Treasury Bond ETF a key tech ETF breaks and another teetersthree defensive stocks with bullish breakouts

 Click here to learn more and gain immediate access.

—————————————

0
FacebookTwitterGoogle +Pinterest
previous post
Texas judge who previously deemed DACA illegal reaffirms ruling
next post
Bonds: Don’t Forget the Long-Term Trend

Related Posts

Which Way Is The Dollar Heading? Watch This...

June 19, 2023

Discover the BEST Way to Spot TREND CHANGES

January 23, 2025

Ozempic Set the Stage, But Could Novo’s Newest...

March 9, 2024

S&P 500 Still SUPER Undervalued!

January 24, 2024

Stock Market Starts December On A Strong Note:...

December 2, 2023

GNG TV: Active vs. Passive Investing

January 19, 2024

Down-and-Out Stocks Entering New Uptrends – These 8...

June 12, 2023

Investors Await CPI and Bank Earnings: Will They...

January 16, 2025

Top 10 July 2025 Stock Picks You Shouldn’t...

July 2, 2025

Major Shifts Taking Place As Lower Rate Bets...

May 18, 2024

    Get free access to all of the retirement secrets and income strategies from our experts! or Join The Exclusive Subscription Today And Get the Premium Articles Acess for Free


    By opting in you agree to receive emails from us and our affiliates. Your information is secure and your privacy is protected.

    Latest

    • S&P 500 Breaking Out Again: What This Means for Your Portfolio

    • Graphite One Confirms Rare Earth Elements at Alaska Deposit

    • Living Plants Offer New Path to Rare Earths Supply, Study Shows

    • Silver Stocks: 5 Biggest Companies in 2025

    • East Star and Endeavour Mining to Collaborate on Kazakhstan Gold Assets

    • Rio Tinto and Calix to Partner on Zero Emissions Steel Technology Plant

    Categories

    • Business (1,411)
    • Investing (3,166)
    • Politics (3,699)
    • Stocks (1,854)
    • Uncategorized (20)
    • About us
    • Contact us
    • Privacy Policy
    • Terms & Conditions

    Disclaimer: MoneyControlPlace.com, its managers, its employees, and assigns (collectively “The Company”) do not make any guarantee or warranty about what is advertised above. Information provided by this website is for research purposes only and should not be considered as personalized financial advice. The Company is not affiliated with, nor does it receive compensation from, any specific security. The Company is not registered or licensed by any governing body in any jurisdiction to give investing advice or provide investment recommendation. Any investments recommended here should be taken into consideration only after consulting with your investment advisor and after reviewing the prospectus or financial statements of the company.

    Copyright © 2025 moneycontrolplace.com | All Rights Reserved