Money Control Place
  • Politics
  • Business
  • Stocks
  • Investing
  • Politics
  • Business
  • Stocks
  • Investing

Money Control Place

Stocks

Wrong Data Gets Wrong Answers

by November 27, 2023
November 27, 2023
Wrong Data Gets Wrong Answers

A recent article on the Business Insider site reported a set of Death Cross/Golden Cross signals on the Dow Jones Industrial Average ($INDU). Specifically, on November 13 the 50-day moving average crossed down through the 200-day moving average, commonly called a Death Cross. Two days later the 50-day moving average crossed back up through the 200-day moving average, commonly called a Golden Cross. I was surprised by this claim because I follow the Dow and these crossovers, and I had not observed such events.

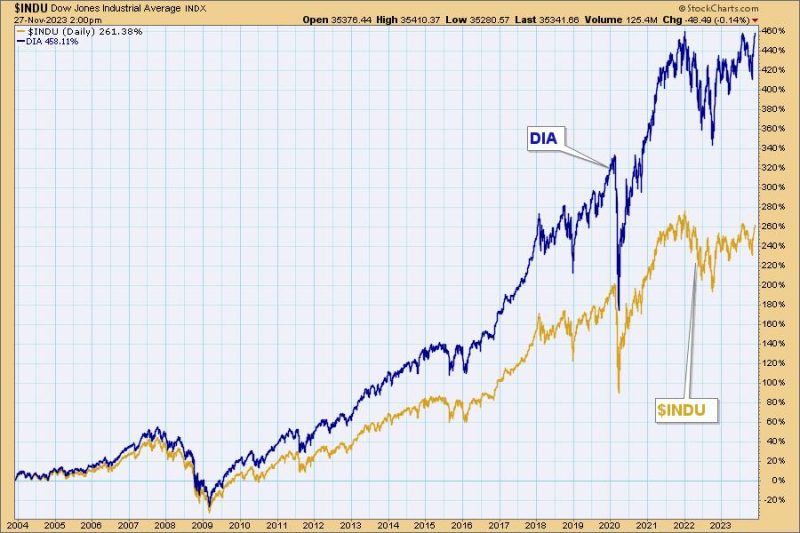
I quickly discovered the problem. The symbol $INDU is the official Dow Jones Industrial Average, but the problem is that the data for this symbol are not adjusted for dividends, as are the data for stocks, mutual funds, and ETFs. In fact, none of data for the major market indexes ($SPX, $NDX, $NYA, $COMPQ, etc.) are adjusted for dividends, so if you want to perform technical analysis on them, it is best to use the corresponding ETF.

This chart illustrates the point. Adjusting prior data for dividends changes the price index into a total return index by incorporating dividends into the data.

Now here is a chart using $INDU data. Note the whipsaw.

Now here is a chart using the Dow Jones Industrial Average ETF (DIA). The whipsaw never happens.

While the data for major market indexes is not adjusted (probably to avoid confusion regarding historical references), there are data sets other than ETFs available, usually called total return indexes. For example, symbol for the total return index for the Dow is $DJITR. Personally, I prefer the ETF.

Conclusion: When performing technical analysis, be sure that the data is adjusted for distributions (dividends and splits). Charting services like StockCharts.com perform the calculations as a matter of course.

Learn more about DecisionPoint.com:

Watch the latest episode of DecisionPoint on StockCharts TV’s YouTube channel here!

Try us out for two weeks with a trial subscription!

Use coupon code: DPTRIAL2 at checkout!

Technical Analysis is a windsock, not a crystal ball. –Carl Swenlin

(c) Copyright 2023 DecisionPoint.com

Disclaimer: This blog is for educational purposes only and should not be construed as financial advice. The ideas and strategies should never be used without first assessing your own personal and financial situation, or without consulting a financial professional. Any opinions expressed herein are solely those of the author, and do not in any way represent the views or opinions of any other person or entity.

DecisionPoint is not a registered investment advisor. Investment and trading decisions are solely your responsibility. DecisionPoint newsletters, blogs or website materials should NOT be interpreted as a recommendation or solicitation to buy or sell any security or to take any specific action.

Helpful DecisionPoint Links:

DecisionPoint Alert Chart List

DecisionPoint Golden Cross/Silver Cross Index Chart List

DecisionPoint Sector Chart List

DecisionPoint Chart Gallery

Trend Models

Price Momentum Oscillator (PMO)

On Balance Volume

Swenlin Trading Oscillators (STO-B and STO-V)

ITBM and ITVM

SCTR Ranking

Bear Market Rules

0
FacebookTwitterGoogle +Pinterest
previous post
Week Ahead: NIFTY Likely To Continue To Consolidate; May Stay Within The Broad Trading Range
next post
Market Secrets Revealed! Final Bar Mailbag — US Dollar, S&P 500 ETF, Fibonacci Pivots

Related Posts

The Best Since 2000!

June 24, 2023

Week Ahead: NIFTY May Stay Tentative In The...

June 25, 2023

How the S&P 500 Reaches 6500 By March...

January 21, 2025

Surprise Negative Divergence on Nasdaq Advance-Decline Line

March 27, 2024

From Relic To Reckoning: Can Gold Surge To...

April 13, 2024

Moving from Thrust Signals to a Bull Market

May 24, 2025

Equity Markets Struggle to Hold onto “Go” trend...

April 19, 2024

Dow Theory Flashes Bear Signal

May 25, 2024

Week Ahead: What Should You Do As Nifty...

April 19, 2025

Key Support Levels Broken, BUT Breadth is Bullish!

March 14, 2024

    Get free access to all of the retirement secrets and income strategies from our experts! or Join The Exclusive Subscription Today And Get the Premium Articles Acess for Free


    By opting in you agree to receive emails from us and our affiliates. Your information is secure and your privacy is protected.

    Latest

    • Breakouts, Momentum & Moving Averages: 10 Must-See Stock Charts Right Now

    • Week Ahead: NIFTY Stays In A Defined Range; Moving Past This Level Crucial For Resumption Of Upmove

    • Editor’s Picks: Gold Faces Bumpy Week on Trade Tensions, Platinum Stages Breakout

    • Run Your Stock Portfolio Like a Pro Sports Team

    • Leadership Rotation Could Confirm Corrective Phase

    • Breakouts, Momentum & Moving Averages: 10 Must-See Stock Charts Right Now

    Categories

    • Business (1,223)
    • Investing (2,504)
    • Politics (3,699)
    • Stocks (1,616)
    • Uncategorized (20)
    • About us
    • Contact us
    • Privacy Policy
    • Terms & Conditions

    Disclaimer: MoneyControlPlace.com, its managers, its employees, and assigns (collectively “The Company”) do not make any guarantee or warranty about what is advertised above. Information provided by this website is for research purposes only and should not be considered as personalized financial advice. The Company is not affiliated with, nor does it receive compensation from, any specific security. The Company is not registered or licensed by any governing body in any jurisdiction to give investing advice or provide investment recommendation. Any investments recommended here should be taken into consideration only after consulting with your investment advisor and after reviewing the prospectus or financial statements of the company.

    Copyright © 2025 moneycontrolplace.com | All Rights Reserved