Money Control Place
  • Politics
  • Business
  • Stocks
  • Investing
  • Politics
  • Business
  • Stocks
  • Investing

Money Control Place

Stocks

The Ord Oracle November 21, 2023

by November 22, 2023
November 22, 2023
The Ord Oracle November 21, 2023

SPX Monitoring Purposes: Long SPX 10/27/23 at 4117.37.
Gain since 12/20/22: Over 26%.
Monitoring Purposes GOLD:  Long GDX on 10/9/20 at 40.78.  

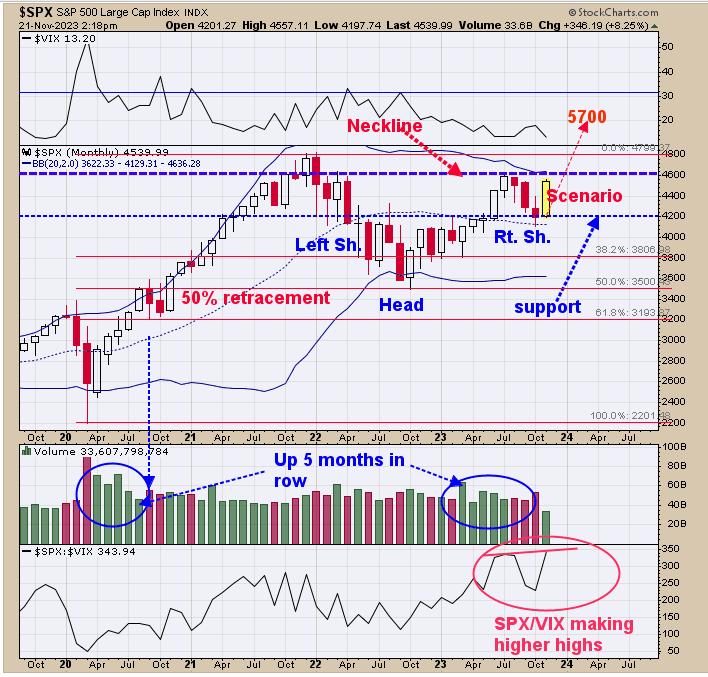
Above is the monthly SPX chart. The pattern that appears to be forming is a head-and-shoulders bottom and the right shoulder is forming now. The neckline lies near the 4600 range and would need a “Sign of Strength” through that level to confirm this pattern. The bottom window is the monthly SPX/VIX ratio, which has made a higher high, while the SPX so far has made a lower high. The SPX/VIX ratio leads the SPX, suggesting that, at some point, the SPX will break to a higher high. We are long SPX 10/27/23 at 4117.37.

We updated this chart from yesterday. The bottom window is the SPY, and next higher window is the TLT/VVIX ratio. It is common near short-term highs for the SPY to make higher highs and the TLT/VVIX ratio to make lower highs (noted in shaded pink). What we are seeing now is that the SPY is continuing to make higher highs and the TLT/VVIX ratio is also making higher highs, suggesting the current rally may continue (noted in shaded light blue). The SPY was up 5 days in a row going into Monday; going up 5 days in a row foretells the market will be higher within five days 83% of the time.

Last Thursday’s report said, “above is the Bullish percent index for the Gold Miners index. The bullish percent index measures the percent on stocks that are on point and figure buy signals. For a valid bullish signal, the Bullish Percent index would need to rise. Since the beginning of October, the bullish percent index has been rising from 10% to the current reading of 25%, which in turn shows this market is getting stronger as more stocks trigger buy signals. GDX has not traded above its previous high of the 30.00 range yet, whereas the bullish percent index has made higher highs, suggesting GDX’s next test of 30.00 will be exceeded.” The bullish percent index now stands at 32.14% and GDX still hasn’t broken 30.00.

0
FacebookTwitterGoogle +Pinterest
previous post
Legal group calls on Michigan bar to investigate, sanction Tlaib over anti-Israel rhetoric
next post
The Stock Market In 3 Charts: Market Breadth, Bonds, Sentiment

Related Posts

How to Identify Great Trade Opportunities Using the...

September 7, 2023

Here Are Two Great Earnings Reports This Past...

February 17, 2025

S&P 500 Breaking Out Again: What This Means...

October 8, 2025

Deciphering Gold’s (GLD) Signals: Is Now the Time...

February 3, 2024

Many Reasons to Love and Hate AMZN Stock

October 26, 2023

Bitcoin Halving Could Bring Massive Upside!

April 17, 2024

Not All Price Gaps Are the Same! Here’s...

May 20, 2025

What Happens When the S&P 500 Breaks Below...

May 24, 2025

Will the Rotation to Small Caps Hold and...

August 29, 2023

Three Sectors are Showing Strength, Three are Not

April 25, 2024

    Get free access to all of the retirement secrets and income strategies from our experts! or Join The Exclusive Subscription Today And Get the Premium Articles Acess for Free


    By opting in you agree to receive emails from us and our affiliates. Your information is secure and your privacy is protected.

    Latest

    • S&P 500 Breaking Out Again: What This Means for Your Portfolio

    • Lithium Market Update: Q3 2025 in Review

    • Despatch of SPP Offer Documents

    • Crypto Market Update: FalconX to Buy 21Shares, Senate Democrats Call Out Trump Envoy

    • Apollo Silver

    • Blackrock Silver Commences Phase 2 Hydrology Program, Geotechnical Evaluation and Seismic Survey on the Tonopah West Project

    Categories

    • Business (1,401)
    • Investing (3,062)
    • Politics (3,699)
    • Stocks (1,828)
    • Uncategorized (20)
    • About us
    • Contact us
    • Privacy Policy
    • Terms & Conditions

    Disclaimer: MoneyControlPlace.com, its managers, its employees, and assigns (collectively “The Company”) do not make any guarantee or warranty about what is advertised above. Information provided by this website is for research purposes only and should not be considered as personalized financial advice. The Company is not affiliated with, nor does it receive compensation from, any specific security. The Company is not registered or licensed by any governing body in any jurisdiction to give investing advice or provide investment recommendation. Any investments recommended here should be taken into consideration only after consulting with your investment advisor and after reviewing the prospectus or financial statements of the company.

    Copyright © 2025 moneycontrolplace.com | All Rights Reserved