Money Control Place
  • Politics
  • Business
  • Stocks
  • Investing
  • Politics
  • Business
  • Stocks
  • Investing

Money Control Place

Stocks

The Ord Oracle September 26, 2023

by September 27, 2023
September 27, 2023
The Ord Oracle September 26, 2023

SPX Monitoring Purposes: Short SPX on 9/1/23 at 4515.77; cover short 9/5/23 at 4496.83 = gain .43%.

Gain since 12/20/22: 15.93%.

Monitoring Purposes GOLD:  Long GDX on 10/9/20 at 40.78.

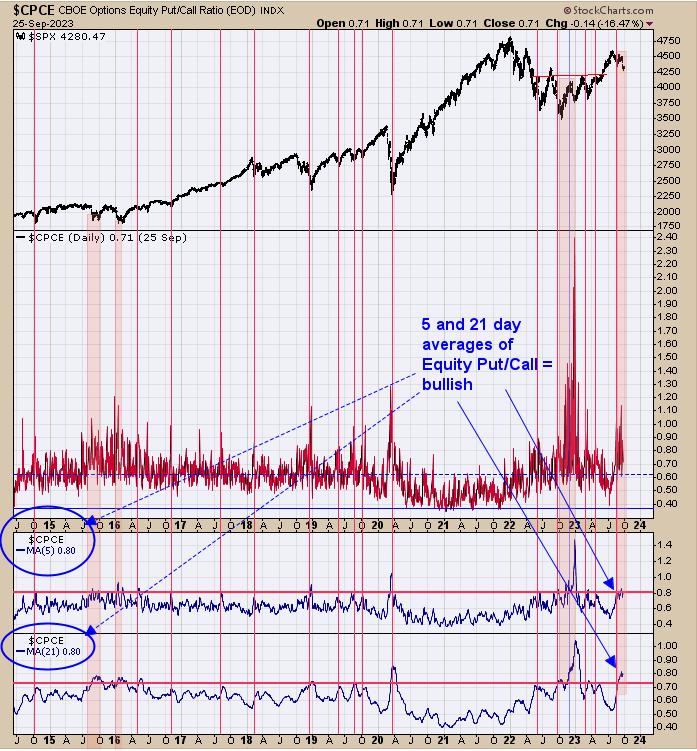
The bottom window is the 21-day average of the CBOE equity put/call ratio, and the next window higher is the 5-day average. We identified the times when both indicators reached bullish levels with red- and pink-shaded areas. As you can see, both are in bullish levels, suggesting a market low is not far off.

The bottom window is the 5-day average of the TRIN and the next higher window is the 10-day TRIN. We shaded in light pink the times when the 10-day TRIN closed above 1.20 and the 5-day TRIN closed above 1.50 and extended the shaded area to the SPY prices. A 10-day TRIN above 1.20 and a 5-day TRIN above 1.50 are normally found near lows in the market. As you can see, both 5- and 10-day TRIN have not reached panic levels (note with red box). Another day or two of declines like today could push both TRIN moving averages to the bullish levels.

We updated this chart from last Thursday, which is the Bullish percent index for the Gold Miners index/GDX ratio. Last Thursday’s chart took this ratio back to mid-2016; the above chart goes back to 2009. The top window is the 28-period RSI, and the next window down is the Bullish Percent index for the Gold Minders index/GDX ratio. A bottom is in for GDX when the RSI of this ratio trades below 30 and than closes above 30. The blue and red lines on the chart above are previous signals. There were 18 signals generated with two failures (noted with red lines), which works out to a 89% success rate. We could see a “back and forth” period, but the chart above has a 89% success rate.

Tim Ord,

Editor

www.ord-oracle.com. Book release “The Secret Science of Price and Volume” by Timothy Ord, buy at www.Amazon.com.

Signals are provided as general information only and are not investment recommendations. You are responsible for your own investment decisions. Past performance does not guarantee future performance. Opinions are based on historical research and data believed reliable; there is no guarantee results will be profitable. Not responsible for errors or omissions. I may invest in the vehicles mentioned above.

0
FacebookTwitterGoogle +Pinterest
previous post
Senate leaders reach short-term budget deal with $6B in Ukraine aid, setting up showdown with House
next post
Nvidia Stock: Why It’s Screaming a Spectacular Buy Signal

Related Posts

Run Your Stock Portfolio Like a Pro Sports...

May 31, 2025

Bullish AND Bearish Options Trade Ideas

January 16, 2025

Sector Spotlight: Bonds Surrender to Strong US Stock...

June 20, 2023

Alibaba Returns to the Scene of the Crime

June 8, 2024

The Best Five Sectors, #16

April 22, 2025

The Ord Oracle August 29, 2023

August 30, 2023

Week Ahead: Broader Markets Set To Relatively Underperform;...

November 4, 2023

Top 10 Stocks to Watch in July 2024!

June 29, 2024

Textbook Double Top on Silver (SLV)

June 1, 2024

How High Will U.S. Yields Fly?

August 19, 2023

    Get free access to all of the retirement secrets and income strategies from our experts! or Join The Exclusive Subscription Today And Get the Premium Articles Acess for Free


    By opting in you agree to receive emails from us and our affiliates. Your information is secure and your privacy is protected.

    Latest

    • Breakouts, Momentum & Moving Averages: 10 Must-See Stock Charts Right Now

    • Week Ahead: NIFTY Stays In A Defined Range; Moving Past This Level Crucial For Resumption Of Upmove

    • Editor’s Picks: Gold Faces Bumpy Week on Trade Tensions, Platinum Stages Breakout

    • Run Your Stock Portfolio Like a Pro Sports Team

    • Leadership Rotation Could Confirm Corrective Phase

    • Breakouts, Momentum & Moving Averages: 10 Must-See Stock Charts Right Now

    Categories

    • Business (1,223)
    • Investing (2,504)
    • Politics (3,699)
    • Stocks (1,616)
    • Uncategorized (20)
    • About us
    • Contact us
    • Privacy Policy
    • Terms & Conditions

    Disclaimer: MoneyControlPlace.com, its managers, its employees, and assigns (collectively “The Company”) do not make any guarantee or warranty about what is advertised above. Information provided by this website is for research purposes only and should not be considered as personalized financial advice. The Company is not affiliated with, nor does it receive compensation from, any specific security. The Company is not registered or licensed by any governing body in any jurisdiction to give investing advice or provide investment recommendation. Any investments recommended here should be taken into consideration only after consulting with your investment advisor and after reviewing the prospectus or financial statements of the company.

    Copyright © 2025 moneycontrolplace.com | All Rights Reserved