Money Control Place
  • Politics
  • Business
  • Stocks
  • Investing
  • Politics
  • Business
  • Stocks
  • Investing

Money Control Place

Stocks

The Ord Oracle September 11, 2023

by September 12, 2023
September 12, 2023
The Ord Oracle September 11, 2023

SPX Monitoring Purposes: Short SPX on 9/1/23 at 4515.77; cover short 9/5/23 at 4496.83 = gain .43%.

Gain since 12/20/22: 15.93%.

Monitoring Purposes GOLD: Long GDX on 10/9/20 at 40.78.

Today’s trading tested the gap of 9/6 on lighter volume, suggesting the gap has resistance and the market could stall near current levels. Option expiration week, which is this week, leans bullish. The bottom window is the 10-day average of the TRIN, which stands at .99; readings near 1.20 and higher are bullish. This low of a 10-day TRIN suggests market may not have enough panic to push higher. The next window higher is the VIX with a reading of 13.79; readings below 17 lean bullish. The market is not giving a clear signal. SPY could drop back to support near 444 and, if panic is present, could start a rally; if not present, the 444 SPY support may fail. Not a clear signal, so we will stay neutral for now.

Join me on TFNN.com Tuesday 3:30 Eastern; Thursday 3:20 Eastern, Tune in!

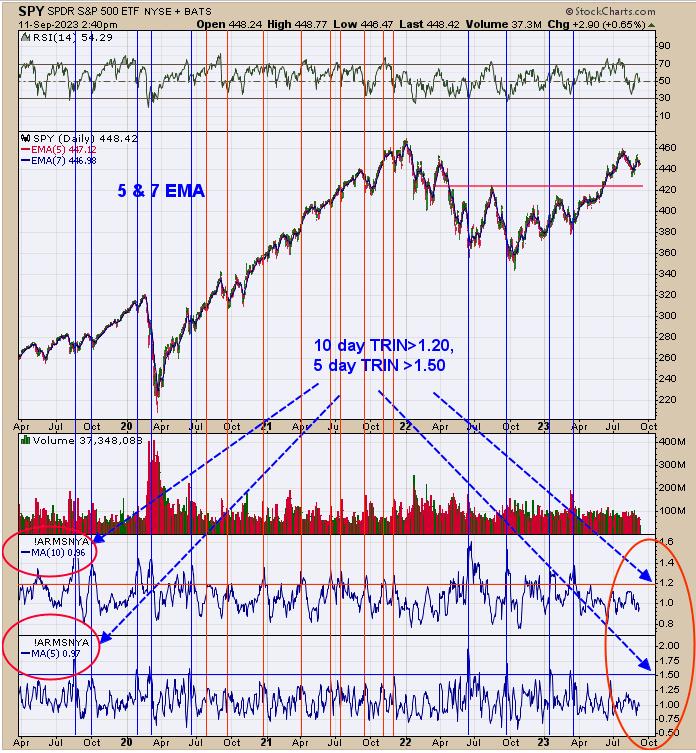
Last Thursday, we presented the SPX/VIX ratio, which leaned bullish (see last Thursday’s report). The bottom window in the chart above is the 5-day average of the TRIN, and the next window higher is the 10-day average of the TRIN. When the 5-day TRIN reaches 1.50 and 10-day TRIN reaches 1.20, a market low is near. The blue lines show when both 5- and 10-day TRIN reach bullish levels, and the red lines show only when the 10-day TRIN reaches bullish levels. Currently, both 5- and 10-day TRINS are not near bullish levels. The TRIN closes help to identify panic, and panic forms near lows in the market. Right now, the TRIN readings are not near levels where a worthwhile low is forming. There can be short term bounces, but a lasting low has not formed yet according to the TRIN indicators.

The bottom window is the 18-day average of the Up Down Volume percent, and the next window higher is the 18-day average of the Advance/Decline percent (both for GDX). This chart looks at the shorter timeframe, where signals can last as little as a week to as long as several months. The chart on last Thursday’s report for GDX looked at the big picture, where signals last years. Currently, both indicators closed above -10 and on a buy signal, and as long both indicators remain above -10, the buy signal will continue. We also have these indicators on a 50-day average, which looks at the intermediate-term where signals can last several months. These indicator trigger buy signals when both close above “0”; currently, both are coming in near -2 range and may kick in a buy signal in the coming days.

Tim Ord,

Editor

www.ord-oracle.com. Book release “The Secret Science of Price and Volume” by Timothy Ord, buy at www.Amazon.com.

Signals are provided as general information only and are not investment recommendations. You are responsible for your own investment decisions. Past performance does not guarantee future performance. Opinions are based on historical research and data believed reliable; there is no guarantee results will be profitable. Not responsible for errors or omissions. I may invest in the vehicles mentioned above.

0
FacebookTwitterGoogle +Pinterest
previous post
Breadth is Not Keeping Pace with the Bounce
next post
Chesapeake Energy: A Stock That Could Pump Much More

Related Posts

Did Friday’s Reversal Mark A Major Bottom?

March 9, 2025

Here’s Why Growth Stocks Outperformed Last Week!

December 9, 2023

The Hidden Meaning Behind the Tech Sector’s Rally...

May 2, 2025

Sector Spotlight: Latest Drop in US Dollar Sending...

July 18, 2023

Downside Risk in a Bullish Market

March 20, 2024

Larry Williams’ 2024 Market Outlook

December 16, 2023

The Halftime Show: Fixed Income Continues To Fall,...

September 27, 2023

Bullish Buyers Return After Market Selloff

February 2, 2024

Don’t Buy Robinhood Stock… Until You See This...

May 9, 2025

Sector Spotlight: Bonds Surrender to Strong US Stock...

June 20, 2023

    Get free access to all of the retirement secrets and income strategies from our experts! or Join The Exclusive Subscription Today And Get the Premium Articles Acess for Free


    By opting in you agree to receive emails from us and our affiliates. Your information is secure and your privacy is protected.

    Latest

    • S&P 500 Breaking Out Again: What This Means for Your Portfolio

    • CHARBONE Hydrogen Secures Harnois Energies’ Hydrogen Assets to Accelerate Clean Ultra High Purity Hydrogen Production at Sorel-Tracy

    • CHARBONE Hydrogene securise les actifs de production d’hydrogene d’Harnois Energies pour accelerer la production d’hydrogene propre a ultra haute purete a Sorel-Tracy

    • Anteros Metals Enters Into Letter of Intent and Announces Private Placement of up to $1 Million

    • Cartier Cuts 35.5 g/t Au over 0.5 m and 20.4 g/t Au over 0.5 m at Main ; Confirms Near-Surface High-Grade Gold Potential; Advances Toward VG10 Zone

    • Sranan Gold Samples Up To 26.7 Grams Per Tonne Gold in The Poeketi Pit Area of The Tapanahony Project in Suriname

    Categories

    • Business (1,395)
    • Investing (2,995)
    • Politics (3,699)
    • Stocks (1,812)
    • Uncategorized (20)
    • About us
    • Contact us
    • Privacy Policy
    • Terms & Conditions

    Disclaimer: MoneyControlPlace.com, its managers, its employees, and assigns (collectively “The Company”) do not make any guarantee or warranty about what is advertised above. Information provided by this website is for research purposes only and should not be considered as personalized financial advice. The Company is not affiliated with, nor does it receive compensation from, any specific security. The Company is not registered or licensed by any governing body in any jurisdiction to give investing advice or provide investment recommendation. Any investments recommended here should be taken into consideration only after consulting with your investment advisor and after reviewing the prospectus or financial statements of the company.

    Copyright © 2025 moneycontrolplace.com | All Rights Reserved