Money Control Place
  • Politics
  • Business
  • Stocks
  • Investing
  • Politics
  • Business
  • Stocks
  • Investing

Money Control Place

Stocks

Fishhooks

by September 8, 2023
September 8, 2023
Fishhooks

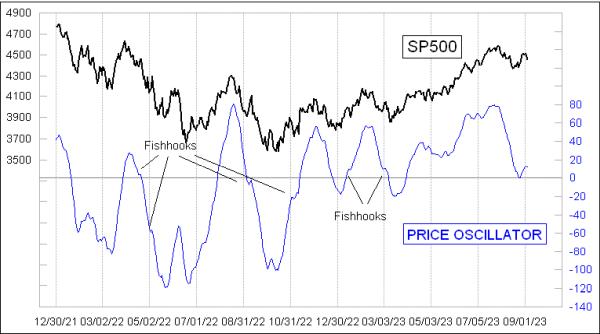
There are fishhook structures forming in several indicators, and here is why we should be getting excited about that. 

A fishhook structure forms in a Price Oscillator or Summation Index chart when there is a brief reversal of trend that does not persist. It can happen in either direction, and this week’s lead chart of the McClellan Price Oscillator for the S&P 500 shows several examples of it happening in both directions. A fishhook says that the effort to reverse course has failed, and that opens the door for a more energetic resumption of the prior trend, whose proponents are now rested and ready to go to work.

One reason we get excited about fishhooks is that they have the potential for a lot of energy on that resumption of the prior trend. It does not always play out that way, but the potential is there. The granddaddy of all fishhooks occurred in early October 1987:

That fishhook arose when a countertrend rally attempt occurred in late September 1987, following the August 25, 1987 price top. The countertrend rally failed, and that opened the door for the bears to resume their decline. The bears had some help in that instance from a brand new Fed chairman named Alan Greenspan, who wanted to let everyone know he was the big new dog in town. He had taken office just 2 weeks before the price top, and he implemented a hike in the Discount Rate on September 4, 1987, just to “mark his territory”.

You may notice in that chart from 1987-88 that there were other fishhooks back then which did not lead to calamity, and most don’t bring us a crash like October 1987. But the potential for a strong trend resumption is there.

The S&P 500 right now is not the only index showing us a fishhook in its Price Oscillator. We see them also in the Price Oscillators of the DJIA and the Nasdaq Composite Index, shown below.

I want to point out a couple of things in that chart of the Nasdaq’s Price Oscillator. Back in early October 2022, there was a fishhook structure which formed when the Price Oscillator was already at a pretty low level. While that did lead to a slightly lower low, it did not bring huge calamity, in part because that market was already pretty stretched and so it is hard to get a lot more downward energy going when you are fighting against the taut bungee cords.In late April 2023, there was a small fishhook structure which also did not bring a big decline. Instead, it resolved with prices turning higher, and turning the Price Oscillator back up again. That is always a possibility. A fishhook structure just represents the potential for a powerful trend resumption, and is no guarantee that we will see one.

You can see additional rules for interpreting fishhook structures in this article.

0
FacebookTwitterGoogle +Pinterest
previous post
GNG TV: XOP’s Strength vs. the S&P’s Weakness
next post
Crucial Insights: How Rising Rates IMPACT You!

Related Posts

Two Key Groups Take a Turn for the...

September 19, 2023

Sizable Selloff: Fed Minutes Crushes Stock Market, Yields...

August 16, 2023

Is the Bear Back?

October 27, 2023

DP Trading Room: Intermediate-Term View of the Magnificent...

April 30, 2024

MEM TV: Here’s What To Do With Base...

October 6, 2023

AMD Spikes Higher as AI Trade Still Kicking

March 1, 2024

Big Rally Ahead Should Yield All-Time High on...

June 7, 2025

Breadth Thrust Can Validate a New Bull Phase...

June 15, 2024

Four Symbols, One Big Message: What the Charts...

July 17, 2025

Betting Against the Fed is RISKY!

February 1, 2024

    Get free access to all of the retirement secrets and income strategies from our experts! or Join The Exclusive Subscription Today And Get the Premium Articles Acess for Free


    By opting in you agree to receive emails from us and our affiliates. Your information is secure and your privacy is protected.

    Latest

    • S&P 500 Breaking Out Again: What This Means for Your Portfolio

    • Tech 5: US Government Strikes Big Tech Deal, Perplexity Plots Expansion

    • Crypto Market Update: Bitcoin Pulls Back After New High, Ethereum ETF Inflows Hit Nearly US$3 Billion

    • Playboy moving its headquarters to Miami Beach and opening a new club

    • S&P 500 Breaking Out Again: What This Means for Your Portfolio

    • Asra Minerals

    Categories

    • Business (1,336)
    • Investing (2,787)
    • Politics (3,699)
    • Stocks (1,761)
    • Uncategorized (20)
    • About us
    • Contact us
    • Privacy Policy
    • Terms & Conditions

    Disclaimer: MoneyControlPlace.com, its managers, its employees, and assigns (collectively “The Company”) do not make any guarantee or warranty about what is advertised above. Information provided by this website is for research purposes only and should not be considered as personalized financial advice. The Company is not affiliated with, nor does it receive compensation from, any specific security. The Company is not registered or licensed by any governing body in any jurisdiction to give investing advice or provide investment recommendation. Any investments recommended here should be taken into consideration only after consulting with your investment advisor and after reviewing the prospectus or financial statements of the company.

    Copyright © 2025 moneycontrolplace.com | All Rights Reserved