Money Control Place
  • Politics
  • Business
  • Stocks
  • Investing
  • Politics
  • Business
  • Stocks
  • Investing

Money Control Place

Stocks

The Ord Oracle June 19, 2023

by July 20, 2023
July 20, 2023
The Ord Oracle June 19, 2023

SPX Monitoring Purposes: Long SPX 6/21/23 at 4365.69.

Long SPX on 2/6/23 at 4110.98: Sold 6/16/23 at 4409.59 = gain of 7.26%.

Monitoring Purposes GOLD:  Long GDX on 10/9/20 at 40.78.

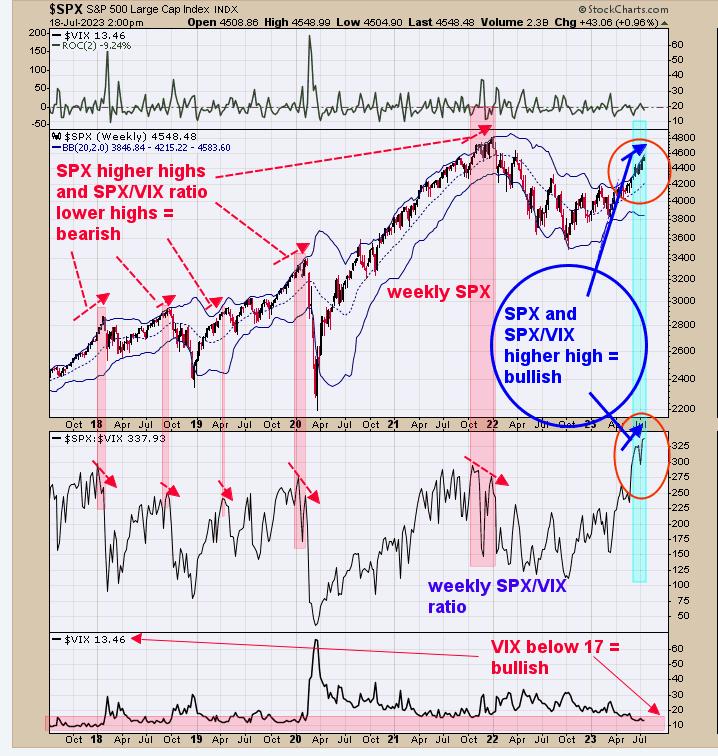
We updated this chart from yesterday, when we said, “The second window up from the bottom is the weekly SPX/VIX ratio. A bearish divergence develops when the weekly SPX makes a higher high and the weekly SPX/VIX ratio makes a lower high (noted in shaded pink). Currently, the weekly SPX has made a higher high along with the weekly SPX/VIX ratio, suggesting bullish divergence for the SPX. The bottom window is the VIX, and readings below 17 suggest the market is in a trending mode; today’s reading stands at 13.51 and remains bullish. Trend appears up for now.” Today’s VIX reading came in at +13.46. We are showing this chart again because the chart is relevant to what is going on in the market. Signs of a high are near when SPX makes a higher high and SPX/VIX ratio makes a lower high, and so far that has not happened.

If a bearish divergence is going to show up, the chart above may first to display it. So far, no significant divergence is present, suggesting the SPX rally can continue.  We updated this chart from yesterday, when we said, “The middle window is the daily VVIX/VIX ratio with a 2-period moving average. VVIX responds faster to market movement than the VIX, and this ratio can responder faster when a market high nearing. So far, the SPX has made higher highs along with the VVIX/VIX ratio and, in turn, leans bullish. Last Friday, the TRIN closed at 1.46 and the TICK closed at -629, which is a bullish combination and suggests the market has panic in it to drive the SPX higher short-term.”

Above is a short-term view of what to expect for GDX. The bottom window is the GDX 18-day average of the Advance/Decline percent, and the next higher window is the GDX 18-day average of the up down volume percent. When both indicators are above -10 (noted in light blue), a rally in GDX is in progress. As long as both indicators remain above -10, the rally in GDX should continue. I’m on TFNN.com Tuesdays 3:30 and Thursdays at 3:20 Eastern Time, tune in.

Tim Ord,

Editor

www.ord-oracle.com. Book release “The Secret Science of Price and Volume” by Timothy Ord, buy at www.Amazon.com.

Signals are provided as general information only and are not investment recommendations. You are responsible for your own investment decisions. Past performance does not guarantee future performance. Opinions are based on historical research and data believed reliable; there is no guarantee results will be profitable. Not responsible for errors or omissions. I may invest in the vehicles mentioned above.

0
FacebookTwitterGoogle +Pinterest
previous post
Hidden Gems: A Simplified Method to Find the Best Stocks
next post
Netflix kills off cheapest no-ads plan in the U.S. and U.K.

Related Posts

MEM TV: How to Trade Nvidia After Its...

May 25, 2024

How the S&P 500 Reaches 6500 By March...

January 18, 2025

MEM TV: Will The Markets to Continue Trading...

November 11, 2023

Watch Stocks Triumph In Latest Asset Allocation Battle

January 19, 2024

Week Ahead: Important For Nifty To Say Above...

September 3, 2023

Why Investors Are Flocking to XPEV Stock: Decoding...

March 7, 2025

Buy the Dips!

July 7, 2023

Bearish ADX Signal on S&P Plays Out –...

March 14, 2025

Lagging Indicators Confirm Bearish Phase For Growth

October 14, 2023

Bullish Rotation Fully Supports Further Gains Ahead

December 3, 2023

    Get free access to all of the retirement secrets and income strategies from our experts! or Join The Exclusive Subscription Today And Get the Premium Articles Acess for Free


    By opting in you agree to receive emails from us and our affiliates. Your information is secure and your privacy is protected.

    Latest

    • Breakouts, Momentum & Moving Averages: 10 Must-See Stock Charts Right Now

    • Week Ahead: NIFTY Stays In A Defined Range; Moving Past This Level Crucial For Resumption Of Upmove

    • Editor’s Picks: Gold Faces Bumpy Week on Trade Tensions, Platinum Stages Breakout

    • Run Your Stock Portfolio Like a Pro Sports Team

    • Leadership Rotation Could Confirm Corrective Phase

    • Breakouts, Momentum & Moving Averages: 10 Must-See Stock Charts Right Now

    Categories

    • Business (1,223)
    • Investing (2,504)
    • Politics (3,699)
    • Stocks (1,616)
    • Uncategorized (20)
    • About us
    • Contact us
    • Privacy Policy
    • Terms & Conditions

    Disclaimer: MoneyControlPlace.com, its managers, its employees, and assigns (collectively “The Company”) do not make any guarantee or warranty about what is advertised above. Information provided by this website is for research purposes only and should not be considered as personalized financial advice. The Company is not affiliated with, nor does it receive compensation from, any specific security. The Company is not registered or licensed by any governing body in any jurisdiction to give investing advice or provide investment recommendation. Any investments recommended here should be taken into consideration only after consulting with your investment advisor and after reviewing the prospectus or financial statements of the company.

    Copyright © 2025 moneycontrolplace.com | All Rights Reserved