Money Control Place
  • Politics
  • Business
  • Stocks
  • Investing
  • Politics
  • Business
  • Stocks
  • Investing

Money Control Place

Stocks

Chart and Trend Signals Align for Datadog

by June 23, 2023
June 23, 2023
Chart and Trend Signals Align for Datadog

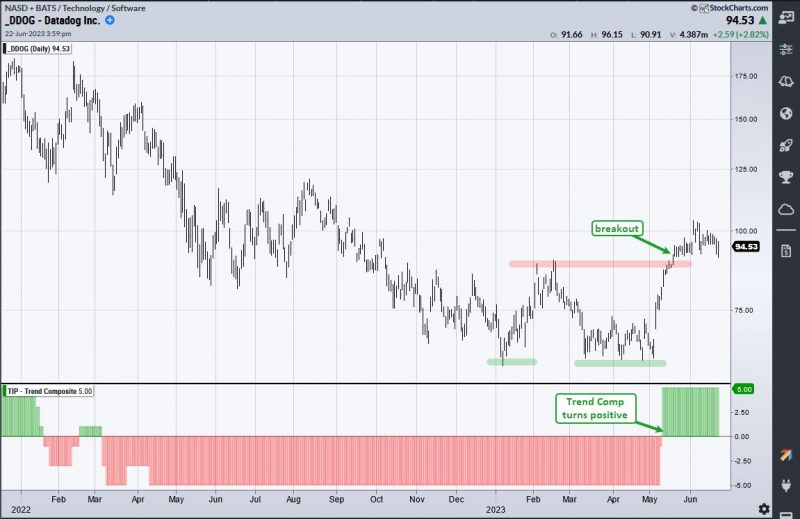
It does not always happen, but sometimes the indicator and chart signals align to send a powerful message. Datadog (DDOG) sports a confirmed bullish reversal on the price chart and a trend signal from the Trend Composite. Today’s article will review these signals and highlight a developing short-term pattern.

The chart below shows Datadog with a confirmed bullish reversal pattern. First, DDOG formed two lows in the low 60s for a Double Bottom (green lines). These lows represent an area of demand (support) in the low 60s. The peak between these two lows marks overhead supply (resistance). Demand prevailed over supply as the stock surged above the red resistance line.  

The indicator window shows the Trend Composite turning positive just before the Double Bottom breakout. The Trend Composite aggregates signals in five trend-following indicators. It surged to +5 and this means all five indicators are bullish. This signal reverses the bearish signal from March 7th, 2022.  

With the long-term trend up, it is now time to look for tradable pullbacks or short-term oversold conditions. The next chart shows broken resistance at 90 (red line) turning into support (green line). This is a classic tenet of technical analysis. One price breaks resistance and demand overpowers supply, the previous supply overhang becomes an area of demand (support).

DDOG pulled back to the breakout with a pennant in June. This is a short-term bullish continuation pattern that is dependent on the prior move for a directional bias. The prior move was up (early May to early June) so this is a bullish continuation pattern. A breakout here would be bullish. Barring a breakout, chartists can watch the Momentum Composite for a move to -3 or lower to signal a short-term oversold condition.

A rotation strategy trading S&P 500 and Nasdaq 100 stocks was just released at TrendInvestorPro. This strategy trades weekly using two trend indicators, two volatility filters and a ranking indicator. Strategy and performance metrics are detailed in a comprehensive article. We will complete this series and introduce a signal table next week. Click here to learn more.

The Trend Composite, Momentum Composite, ATR Trailing Stop and eight other indicators are part of the TrendInvestorPro Indicator Edge Plugin for StockCharts ACP. Click here to take your analysis process to the next level.

—————————————

0
FacebookTwitterGoogle +Pinterest
previous post
Biden stands by calling Xi a ‘dictator’ after comment angers China
next post
Top 10 Oil-producing Countries (Updated 2023)

Related Posts

Market Research and Analysis – Part 1: Why...

March 15, 2024

January: NASDAQ Has the Best Odds of Gains,...

January 4, 2024

Technical Correction? Or Return of the Bear Market?

September 6, 2023

How is the Economic Modern Family Liking Santa...

December 15, 2023

Silver Cross Index is Topping on Broad Market...

January 5, 2024

Secure Your Retirement Happiness: Check Your 401(k) Now!

April 17, 2025

The 4 Best Tech Stocks to Watch Now!

June 28, 2024

Tape Reading for Distribution

February 7, 2024

The Zweig Breadth Thrust Triggers, but the Indicator...

November 11, 2023

The Case for Small-Caps as Major Indexes Test...

November 17, 2023

    Get free access to all of the retirement secrets and income strategies from our experts! or Join The Exclusive Subscription Today And Get the Premium Articles Acess for Free


    By opting in you agree to receive emails from us and our affiliates. Your information is secure and your privacy is protected.

    Latest

    • Breakouts, Momentum & Moving Averages: 10 Must-See Stock Charts Right Now

    • Week Ahead: NIFTY Stays In A Defined Range; Moving Past This Level Crucial For Resumption Of Upmove

    • Editor’s Picks: Gold Faces Bumpy Week on Trade Tensions, Platinum Stages Breakout

    • Run Your Stock Portfolio Like a Pro Sports Team

    • Leadership Rotation Could Confirm Corrective Phase

    • Breakouts, Momentum & Moving Averages: 10 Must-See Stock Charts Right Now

    Categories

    • Business (1,223)
    • Investing (2,504)
    • Politics (3,699)
    • Stocks (1,616)
    • Uncategorized (20)
    • About us
    • Contact us
    • Privacy Policy
    • Terms & Conditions

    Disclaimer: MoneyControlPlace.com, its managers, its employees, and assigns (collectively “The Company”) do not make any guarantee or warranty about what is advertised above. Information provided by this website is for research purposes only and should not be considered as personalized financial advice. The Company is not affiliated with, nor does it receive compensation from, any specific security. The Company is not registered or licensed by any governing body in any jurisdiction to give investing advice or provide investment recommendation. Any investments recommended here should be taken into consideration only after consulting with your investment advisor and after reviewing the prospectus or financial statements of the company.

    Copyright © 2025 moneycontrolplace.com | All Rights Reserved