Money Control Place
  • Politics
  • Business
  • Stocks
  • Investing
  • Politics
  • Business
  • Stocks
  • Investing

Money Control Place

Stocks

Using the ATR Trailing Stop to Manage the Trade and Define the Trend

by March 8, 2024
March 8, 2024
Using the ATR Trailing Stop to Manage the Trade and Define the Trend

As its name suggests, the ATR Trailing Stop is normally used to trail a stop-loss for a long position. It can also be used to identify an outsized decline that could reverse an uptrend. Today’s example will show how to apply the ATR Trailing Stop on a breakout and use it to define the current uptrend in the Technology SPDR (XLK).

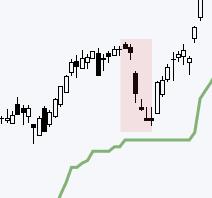
ATR is the Average True Range, which is a volatility indicator developed by J Wells Wilder. The bottom indicator window shows ATR (22) at 3.091 for the Technology SPDR (XLK). The green line on the chart is the ATR Trailing Stop (5 x ATR(22)). 5 is the multiplier. This means it is 5 ATR(22) values below the highest close since November 6th, which is when XLK broke out. When prices rise, this stop will trail prices higher and always remain 5 ATR(22) values below the highest close of the move.

Why did I pick 5 for the multiplier? At the time of the breakout, I choose 5 as the multiplier because this value placed the initial stop just below the late October low (gray line). This is the natural level to set a stop because it represents a support level based on a reaction low. Note that this indicator is part of the TIP Indicator Edge Plugin for StockCharts ACP.

The ATR Trailing Stop can also be used to define an uptrend. There were two sharp pullbacks during the current advance. The red shadings in early January and late February mark these pullbacks. The ATR Trailing Stop held in both cases, which means the pullbacks were less that 5 ATR(22) values. A decline that breaks the ATR Trailing Stop would be greater than 5 ATR(22) values and this would be an outsized decline. Trend changes often happen with outsized moves so I will be watching the ATR Trailing Stop going forward.

Chart Trader reports and videos focus on stocks and ETFs with uptrends and tradeable patterns. Each week we cover the overall market environment and then feature highly curated trading ideas. This week we covered the Copper Miners ETF (COPX), the Metals & Mining SPDR (XME), the Bank ETF (KBWB), Moderna (MRNA), Illumina (ILMN) and more. Click here to learn more and get immediate access.

///////////////////////////////////

0
FacebookTwitterGoogle +Pinterest
previous post
China, Russia float idea for nuclear power on the moon: ‘want to upstage the United States’
next post
David Erfle: Gold Stock Mean Reversion About to Happen, Watch Silver Too

Related Posts

MEM TV: Time To SELL EVERYTHING?!

April 13, 2024

DEFENSE IS ON THE FIELD | GONOGO SHOW...

April 27, 2024

Should We Use Weakness To Accumulate NVDA Before...

October 22, 2023

Breakouts, Momentum & Moving Averages: 10 Must-See Stock...

May 31, 2025

Inflation Data Brings Holiday Cheer as We Head...

December 23, 2023

Earnings, Inflation, Yield Curve & July Reset

July 7, 2023

Two EASY But INSANELY POWERFUL Ways to See...

November 11, 2023

DP Trading Room: Two Industry Groups To Watch!

May 7, 2024

China Tariffs Drive Upside for Rare Earth Minerals

May 15, 2024

MEM TV: Key Areas of Support as Markets...

June 24, 2023

    Get free access to all of the retirement secrets and income strategies from our experts! or Join The Exclusive Subscription Today And Get the Premium Articles Acess for Free


    By opting in you agree to receive emails from us and our affiliates. Your information is secure and your privacy is protected.

    Latest

    • Breakouts, Momentum & Moving Averages: 10 Must-See Stock Charts Right Now

    • Week Ahead: NIFTY Stays In A Defined Range; Moving Past This Level Crucial For Resumption Of Upmove

    • Editor’s Picks: Gold Faces Bumpy Week on Trade Tensions, Platinum Stages Breakout

    • Run Your Stock Portfolio Like a Pro Sports Team

    • Leadership Rotation Could Confirm Corrective Phase

    • Breakouts, Momentum & Moving Averages: 10 Must-See Stock Charts Right Now

    Categories

    • Business (1,223)
    • Investing (2,504)
    • Politics (3,699)
    • Stocks (1,616)
    • Uncategorized (20)
    • About us
    • Contact us
    • Privacy Policy
    • Terms & Conditions

    Disclaimer: MoneyControlPlace.com, its managers, its employees, and assigns (collectively “The Company”) do not make any guarantee or warranty about what is advertised above. Information provided by this website is for research purposes only and should not be considered as personalized financial advice. The Company is not affiliated with, nor does it receive compensation from, any specific security. The Company is not registered or licensed by any governing body in any jurisdiction to give investing advice or provide investment recommendation. Any investments recommended here should be taken into consideration only after consulting with your investment advisor and after reviewing the prospectus or financial statements of the company.

    Copyright © 2025 moneycontrolplace.com | All Rights Reserved